Home / Our water
Your water quality
In 2025 our lab tested 14,600 samples. Your water met or did better than every state and federal drinking water standard.
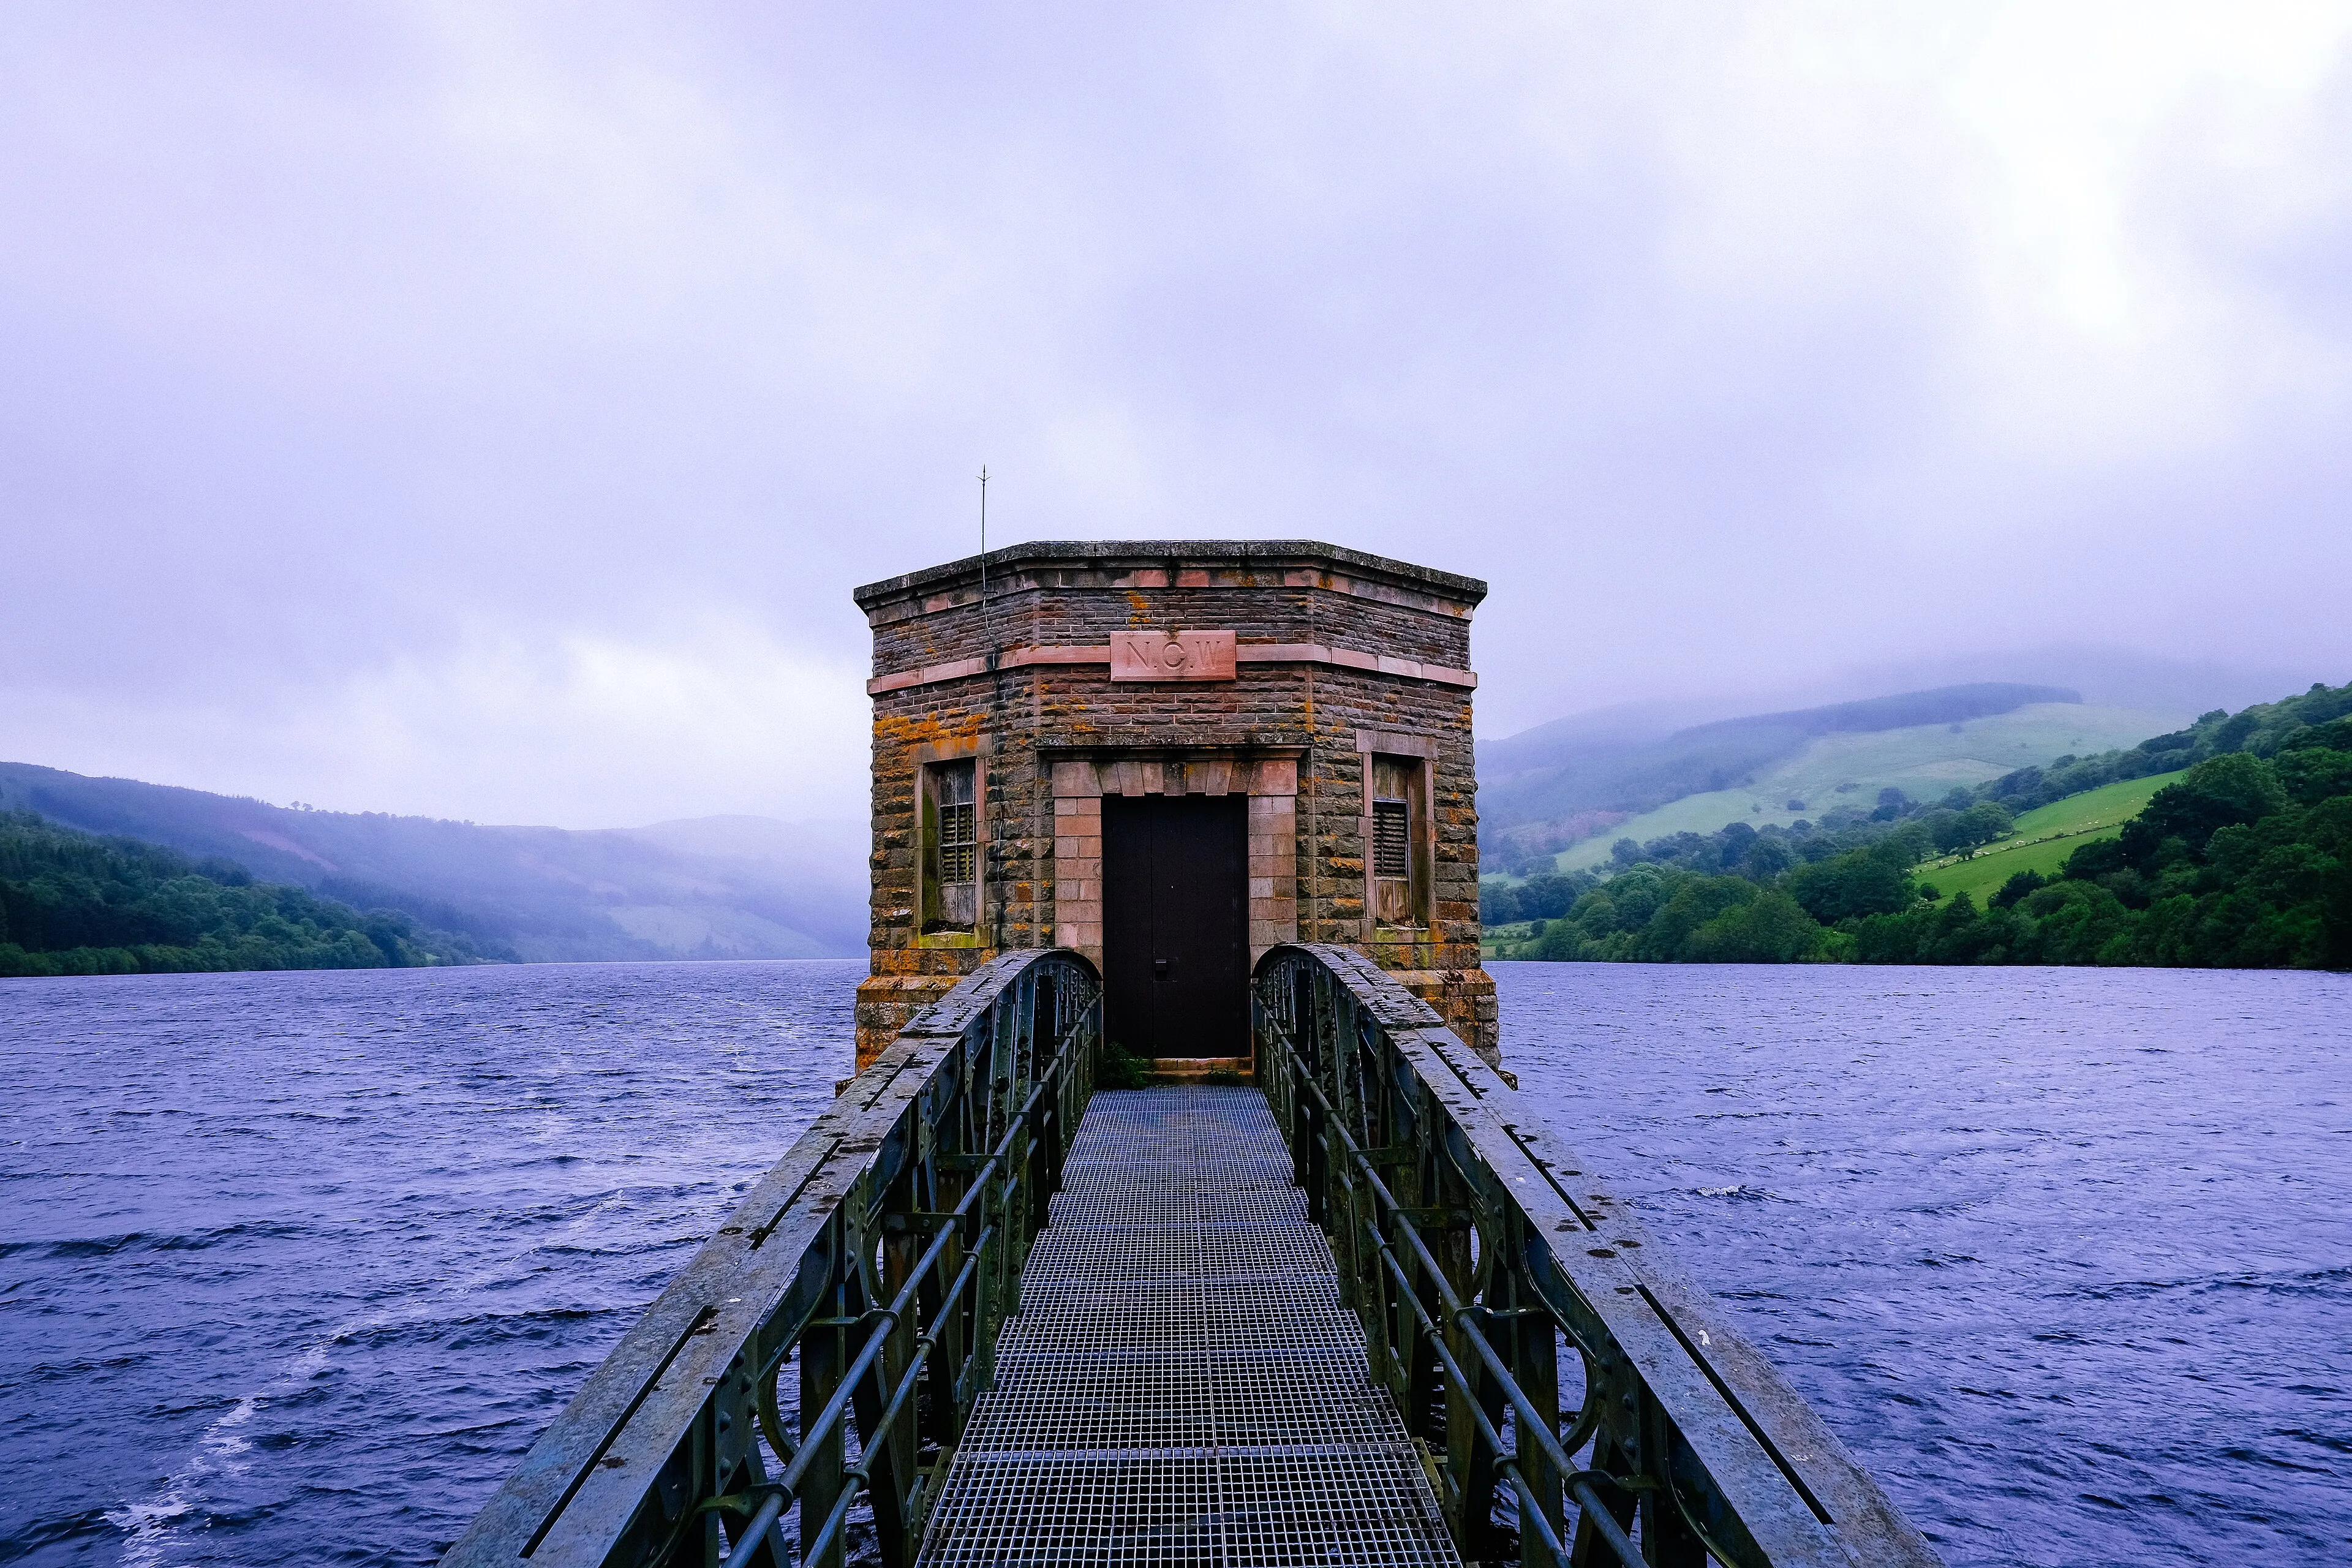
- Source
- Kestrel Reservoir (92%) and two groundwater wells (8%)
- Treatment
- Linden Hill plant: coagulation, filtration, UV and chlorine
- Hardness
- 68 ppm (4 grains per gallon). Moderately soft.
- pH
- 7.6 average
- Fluoride
- 0.7 ppm, the level recommended for dental health
2025 test results
| Substance | Legal limit | Our water | Range | Typical source | Result |
|---|---|---|---|---|---|
| Lead (90th percentile at customer taps) | 15 (action level) ppb | 2.1 ppb | ND–6 | Household plumbing | Meets standard |
| Copper (90th percentile) | 1.3 (action level) ppm | 0.21 ppm | 0.02–0.44 | Household plumbing | Meets standard |
| Nitrate (as N) | 10 ppm | 0.6 ppm | ND–1.1 | Runoff from fertilizer use | Meets standard |
| Total trihalomethanes | 80 ppb | 31 ppb | 18–44 | By-product of disinfection | Meets standard |
| Fluoride | 2.0 ppm | 0.7 ppm | 0.6–0.8 | Added for dental health | Meets standard |
| Turbidity (highest single reading) | 1.0 NTU | 0.09 NTU | 0.02–0.09 | Soil runoff | Meets standard |
ppm = parts per million. ppb = parts per billion. ND = not detected. The full report lists all 124 substances tested.
What is your service line made of?
The service line connects the water main in the street to your meter. We’ve identified 1,140 lead or galvanized lines left in the district and are replacing them all by 2029 at no cost to you.